BOOSTER FUELS
Booster Fuels is an onsite and on-demand fueling provider for individuals and corporate fleets.
Founded the Enterprise Sales Division and supported the Chief Product Officer to build v1 & v2 of the Enterprise Product
Setting
At the beginning of the fleet business, the company focused on providing the service (onsite fuel delivery). That being said, we quickly realized that customers had a need to authenticate fueling and track progress.
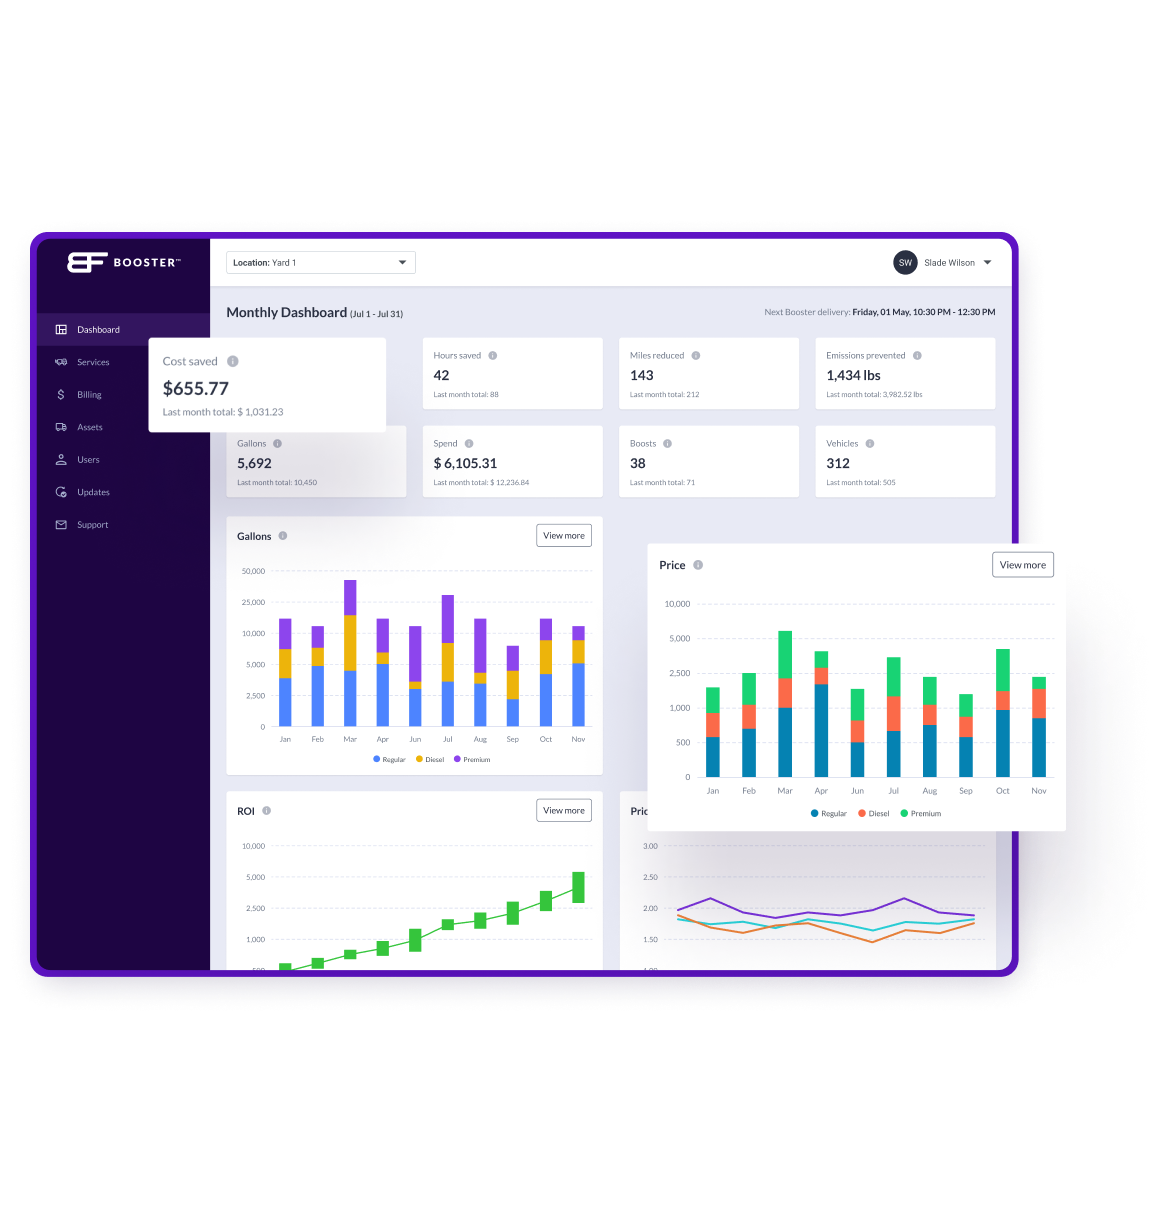
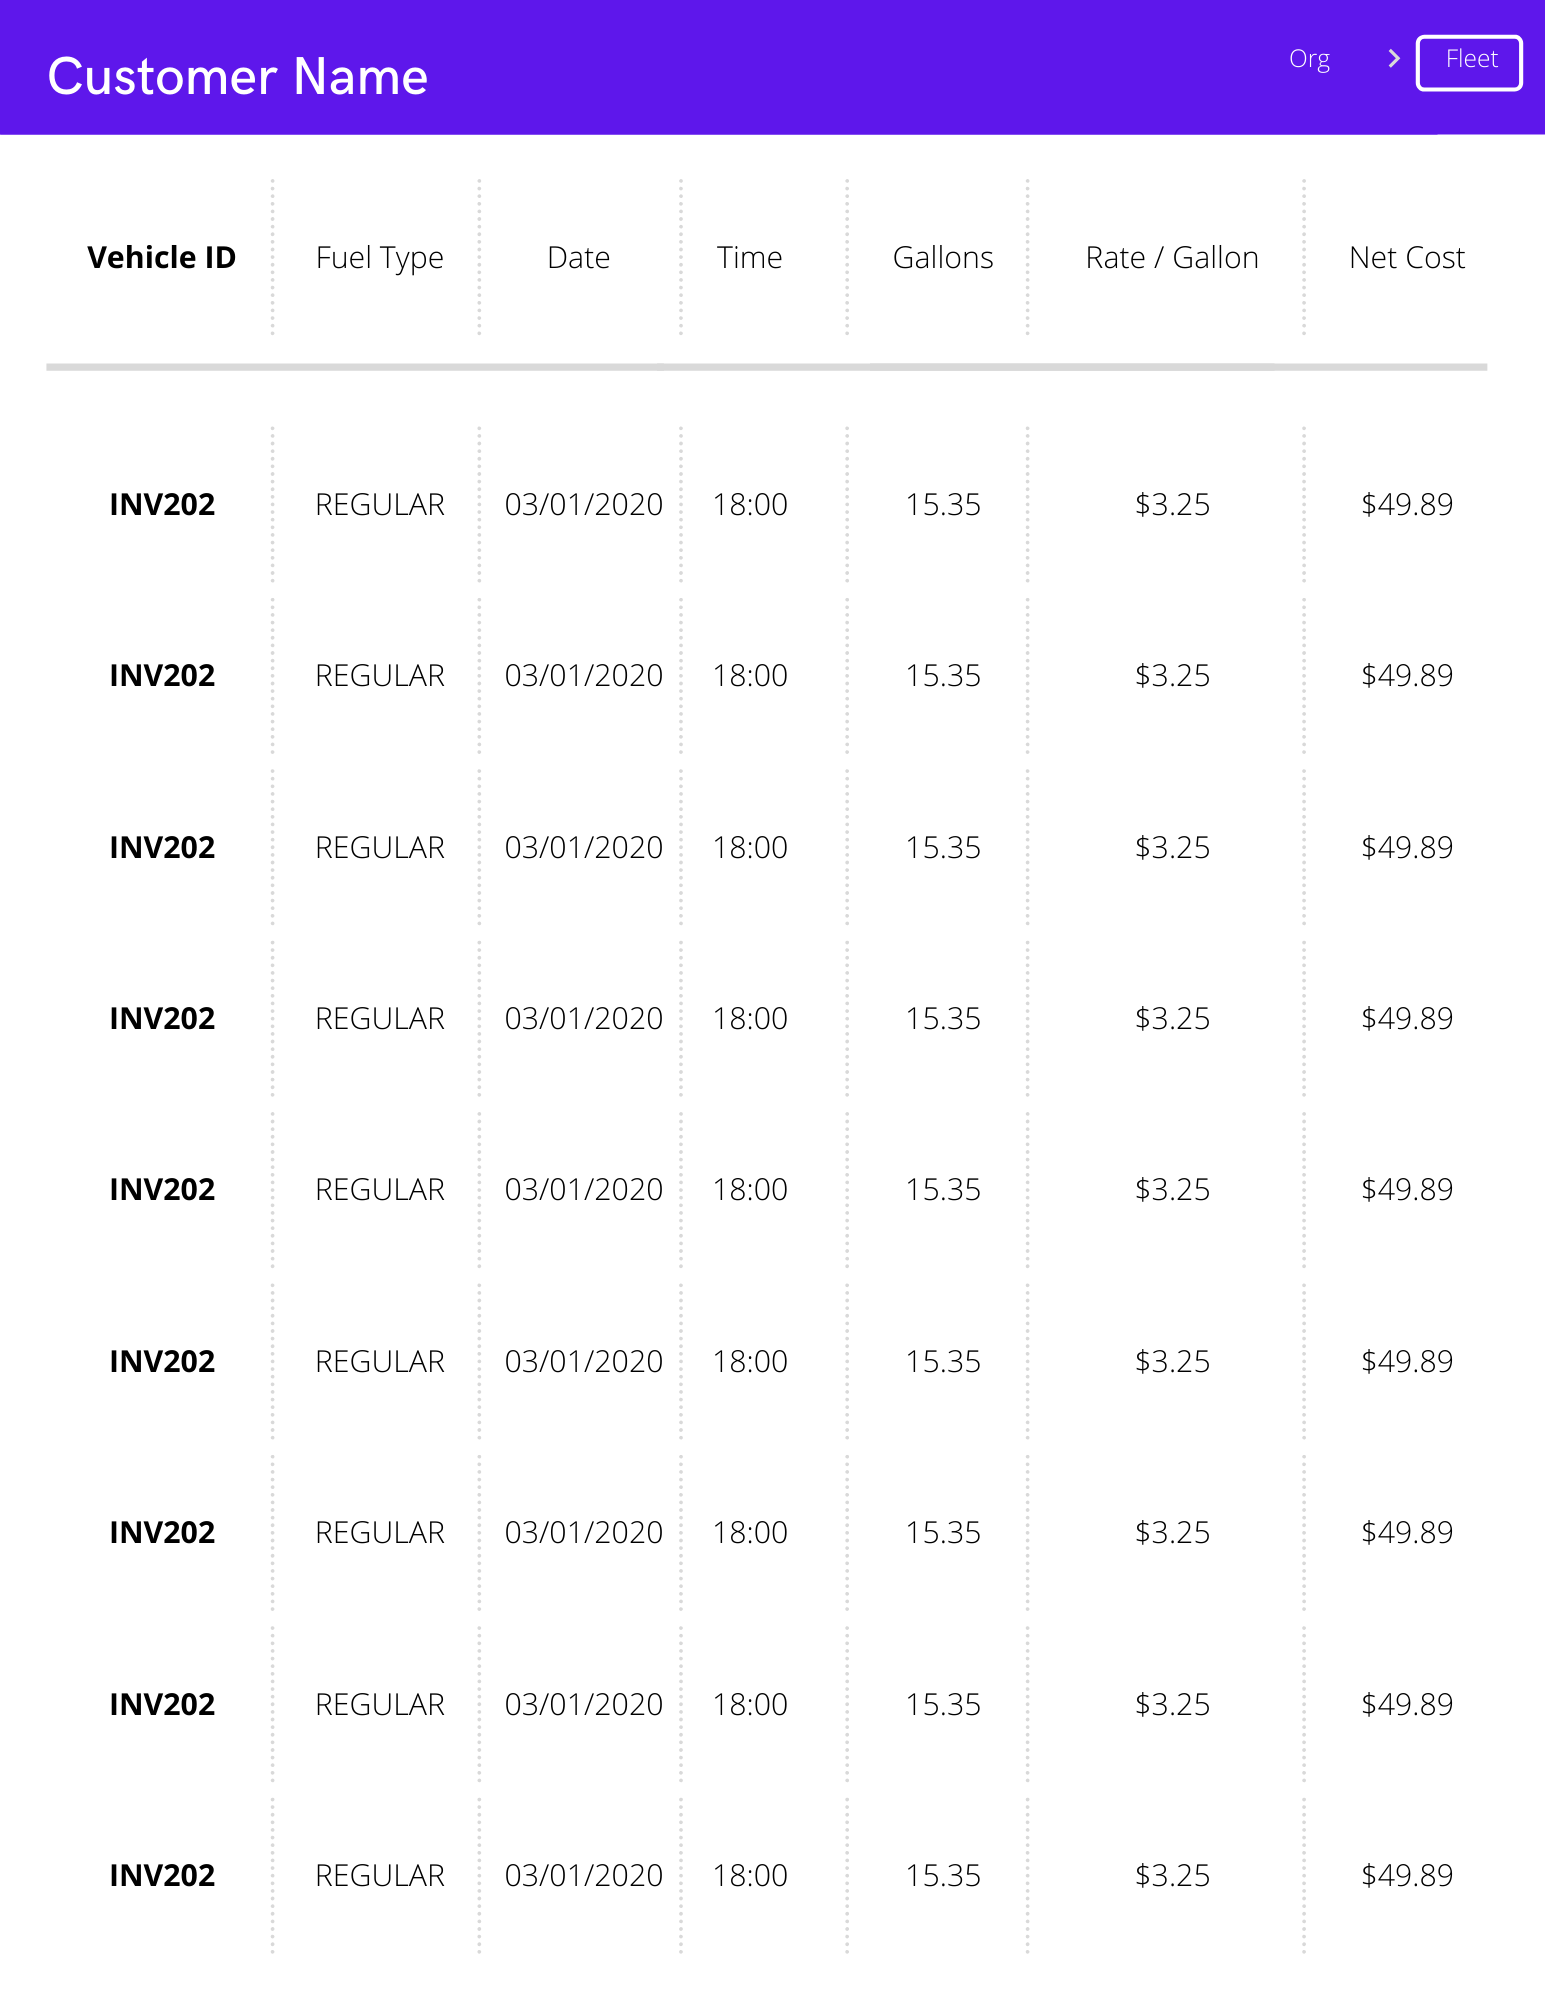
At the time of me coming in, the company had implemented v1 of the Customer Dashboard (see below).
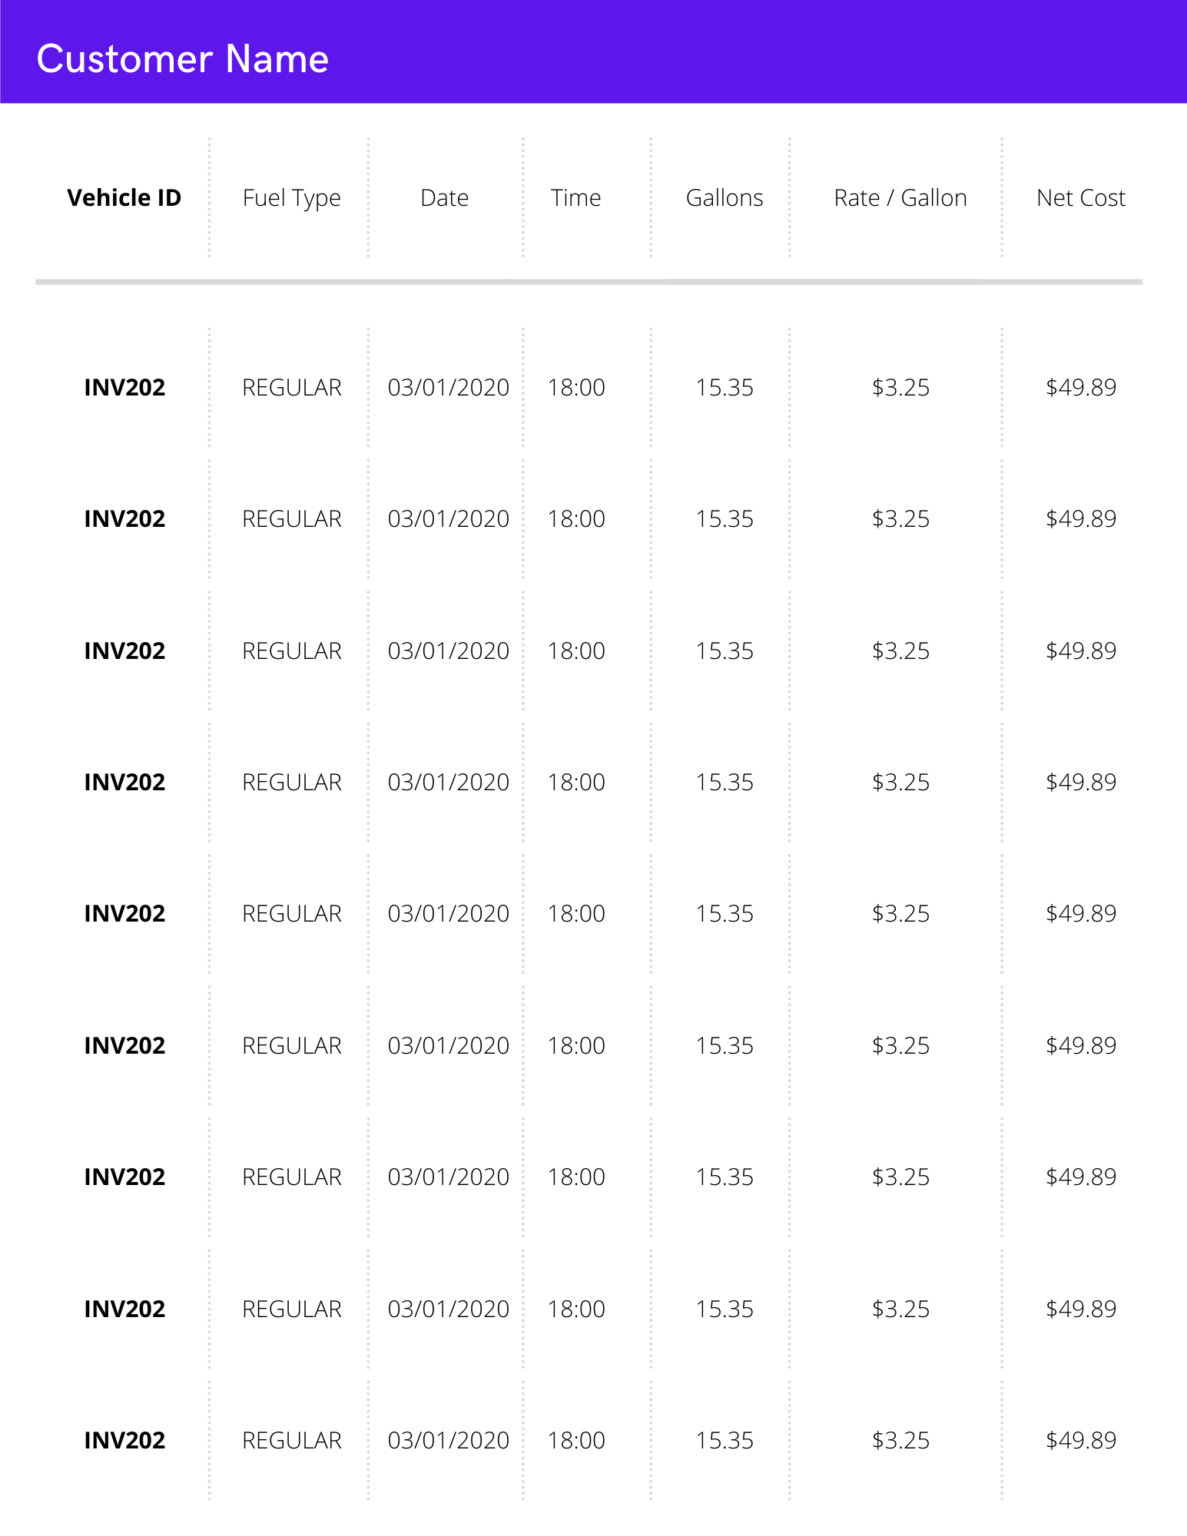
The dashboard emphasized data of immediate need for tracking and ensuring vehicles were being audited for fueling.
This served a purpose for:
- Quality Management
- Vehicle Tracking
- Fueling Tracking
- Cost Updates
- Rate / Gallon
The data was malleable >> able to be downloaded via CSV.
Pain Points
After interviews with decision-makers of varying levels for our customers, we realized that there was increased demand for more advanced analytics based on the type of stakeholder within the organization.
It's one thing to sell value, it's another to ensure the customer sees and affirms that value is taking affect.
Differing stakeholders within an organization (mostly relevant to Enterprise customers) require different data points to satisfy their need for insight into the fueling process. The old framework (as shown above) was myopic in only catering data relevant to the Fleet (local) demographic.
Process
- Hypothesis: Customers want a dashboard that caters to the framework of their organization so that the insight is relevant to users' periphery
- Interview different customers in terms of type and size of fleet (i.e. number of vehicles)
- Private companies
- Public companies
- Verticals
- Landscaping
- Produce
- Catering
- Telecommunications
- Ambulance
- etc.
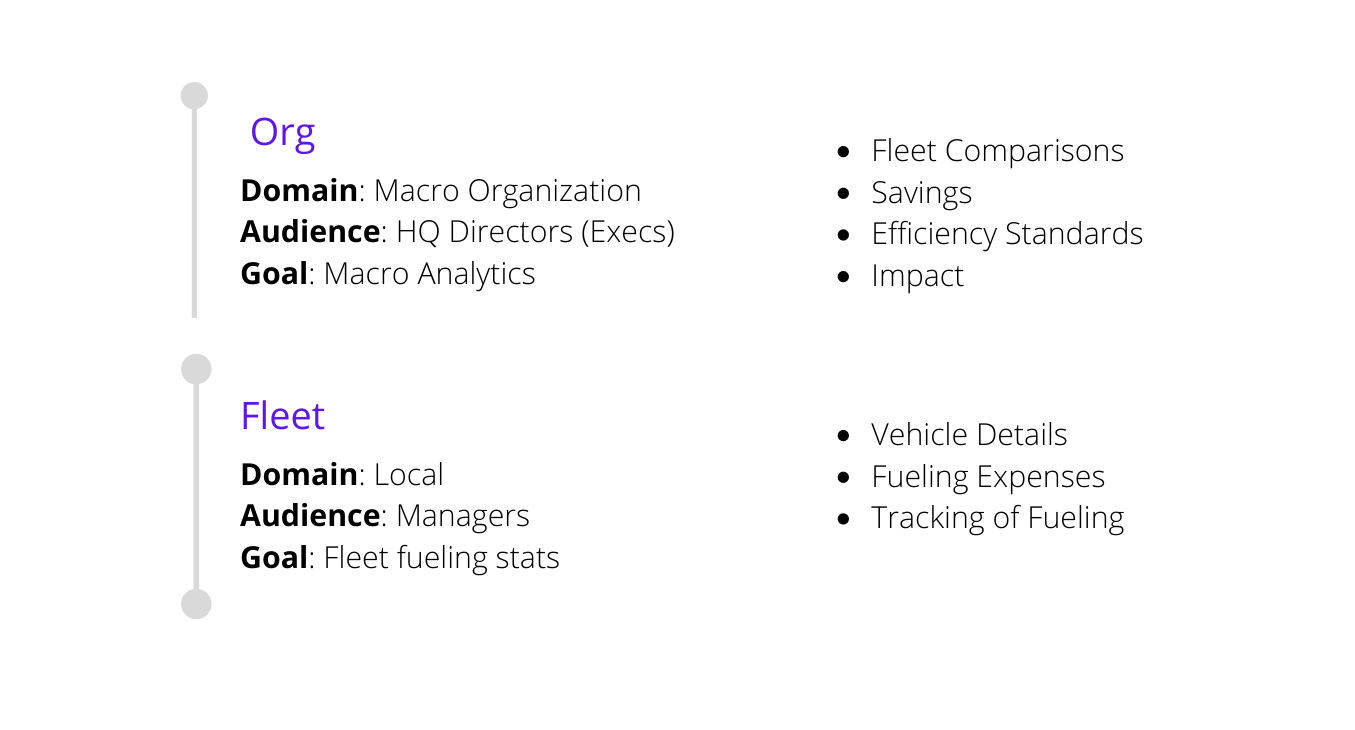
- Define and group tiers of stakeholders and match data relevant to them (see figure to the right)
- Wireframe designs to follow the strategy
Wireframe
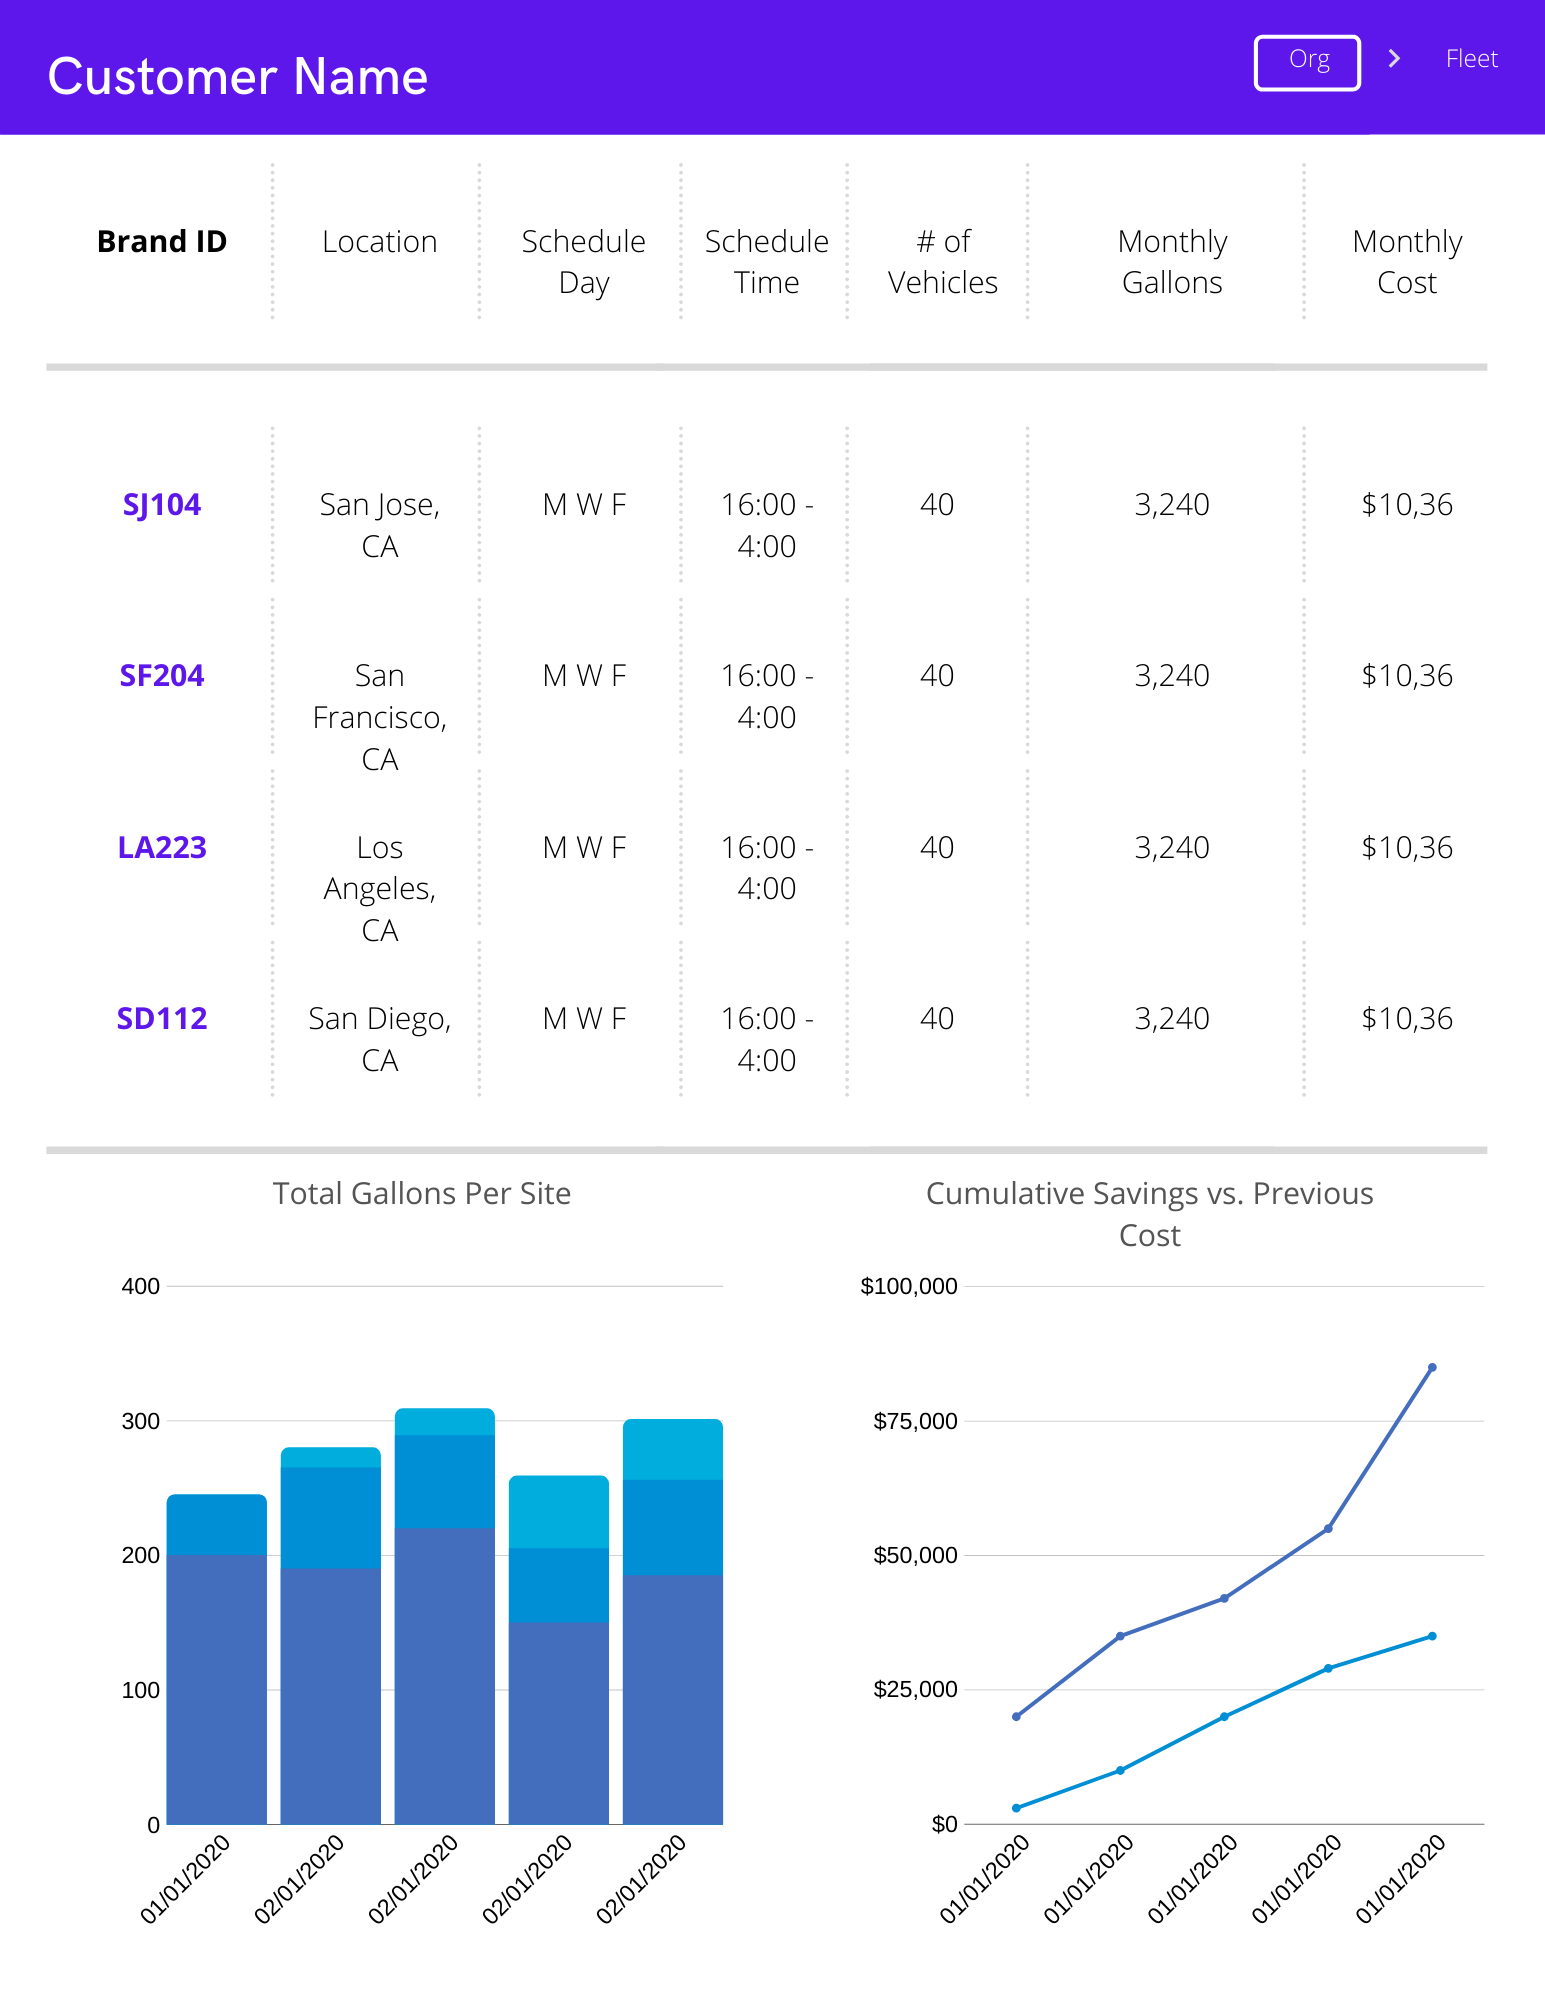
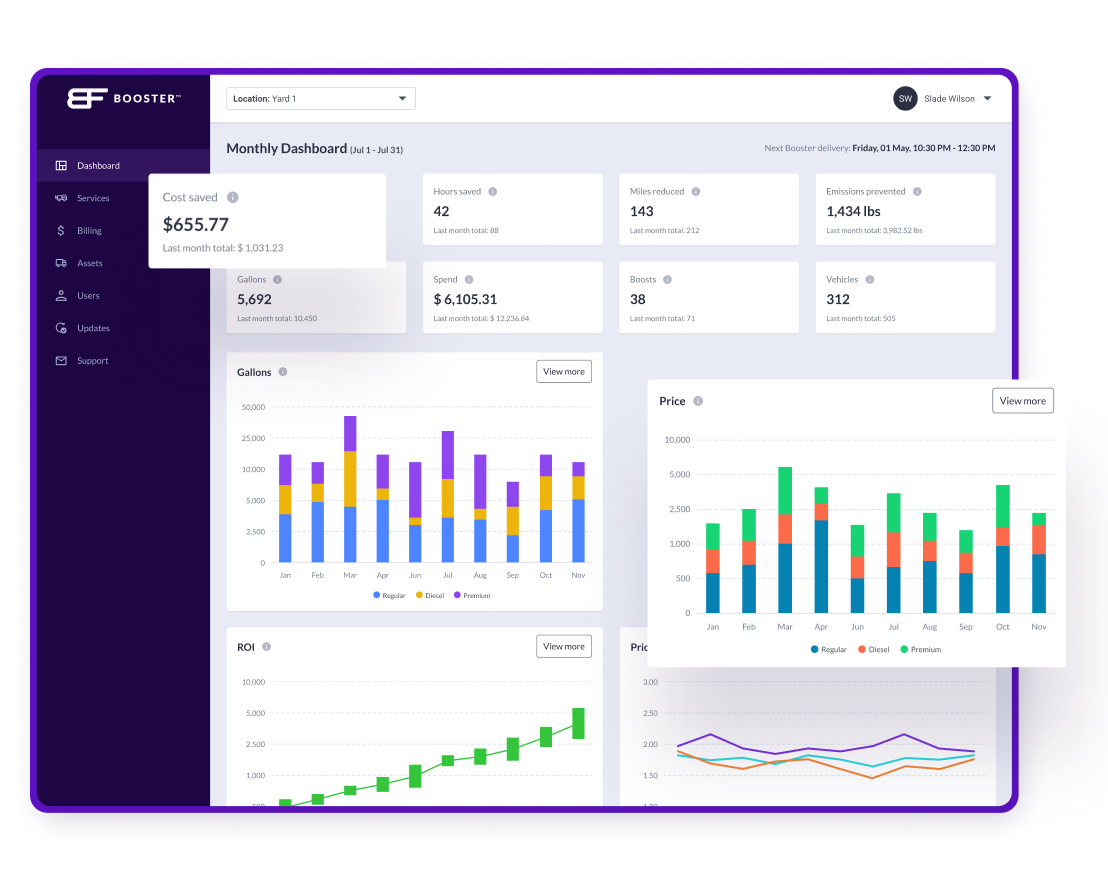
Org Page. The macro dashboard is designed to showcase relevant and historical data for all fleet yards (sites) in aggregate. Users can view high-level information and eventually click on a particular Branch ID to go to the lower-level (fleet).
It includes two graphs:
- Total Gallons per Site which illustrates the total gallons organized by site within a period of time. This shows changes and trends in the total gallons dispensed (which correlates to fleet usage) and the changing dynamics of a particular site with regards to their demand for fuel.
- Cumulative Savings vs. Previous Cost which illustrates the growing savings produced by implementing the Booster program in relation to costs of their program before implementation. Booster changes the dynamic of labor, accident, time, vehicle wear & tear costs. These savings go back to the organization and are calculated on a per vehicle unit (fueling) basis. Given that savings are linear, the chart shows the growing value the program affects the organization.
Version 1
Fleet Page. The micro dashboard expounds on the original data points from v1.
Version 2
Results
- Retention of customers increased to 97%
- Closure rate from Enterprise level prospects increased by 37%
The insight shared with customers positioned Booster as a subject matter expert in a very high variable cost segment for customers.
Future Iteration Ideas
The following ideas, which have been previously been suggested and wireframed are under development:
- Customer Login
- User Access Control
- Fuel Card Integration (Auto-Sync)
- Asset (Vehicle) Inventory Management
- Fleet Level Dashboard
- Issue Troubleshooting and Remedy Update
- Fleet Vehicle Penetration (% of vehicles fueled vs. total vehicles active needing fueling)