

Coordinated with UX Research and Design team to provide high fidelity recommendations for the Co-Founder of organization. The goal is to identify and introduce the design ideas that will optimize the user experience.
CovidActNow.org
We built covidactnow.org to solve an urgent problem: If we try to fight COVID in the present we will lose. We can only beat COVID by understanding what it will do in the future. Our leaders need a forecasting tool to better understand the future spread of COVID. We are building that tool.
Coordinated with UX Research and Design team to provide high fidelity recommendations for the Co-Founder of organization. The goal is to identify and introduce the design ideas that will optimize the user experience.
Team
Setting
CovidActNow was started by four volunteers who saw the explosive and deadly growth of COVID infections around the world and felt they had to do something. The CovidActNow team has partnered with some of America’s preeminent epidemiologists and data scientists to develop the U.S. Interventions Model.
The organization was in the process of defining their product as it better caters to their stakeholders. Meanwhile, states and counties were beginning to institute Shelter-In-Place ordinances to contain the spread of COVID-19.
Pain Point
Stakeholders: Health & Government officials
Problem: Data is decentralized, segregated, and often difficult to track. This leads to decision-making while being ill-informed. Stakeholders did not have data and forecasts, especially at a local (county) level, to reinforce their assumptions and determine the potential implications of their decisions.
Strategy
Our strategy is to identify the design ideas that will optimize the user experience in relation to conversing resources. Given that we entered this project during a time of great change for the organization as it quickly prioritizes backlog items, we wanted to pinpoint features (changes) and quickly organize them according to impact vs. effort
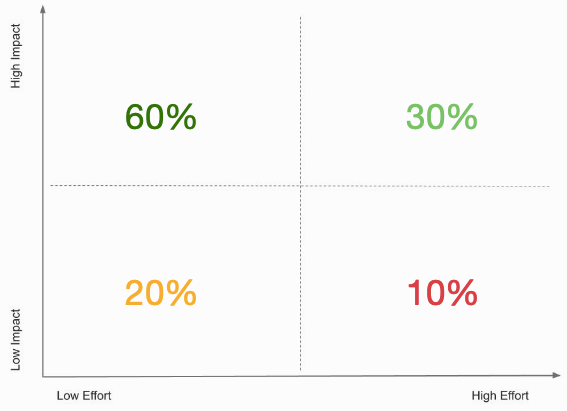
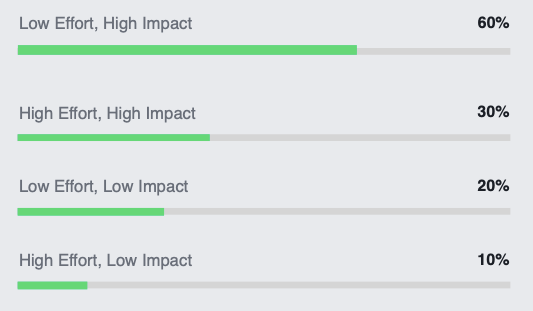
Evaluation
We analyzed the two key types of pages: 1) Homepage (national data); 2) Jurisdiction page (state or county data).

End Result
We presented our recommendations to the Co-Founder of CovidActNow. The ideas will be incorporated into the framework for the next iteration of the website.
1) Homepage (national data)
HIGH IMPACT, HIGH EFFORT
- Allow visitors to view the country, then double click to go to a state level, then to county, etc.
- Hover state should allow for the metrics to come up instantly
- Design UI to inform visitors of functions
LOW IMPACT, LOW EFFORT
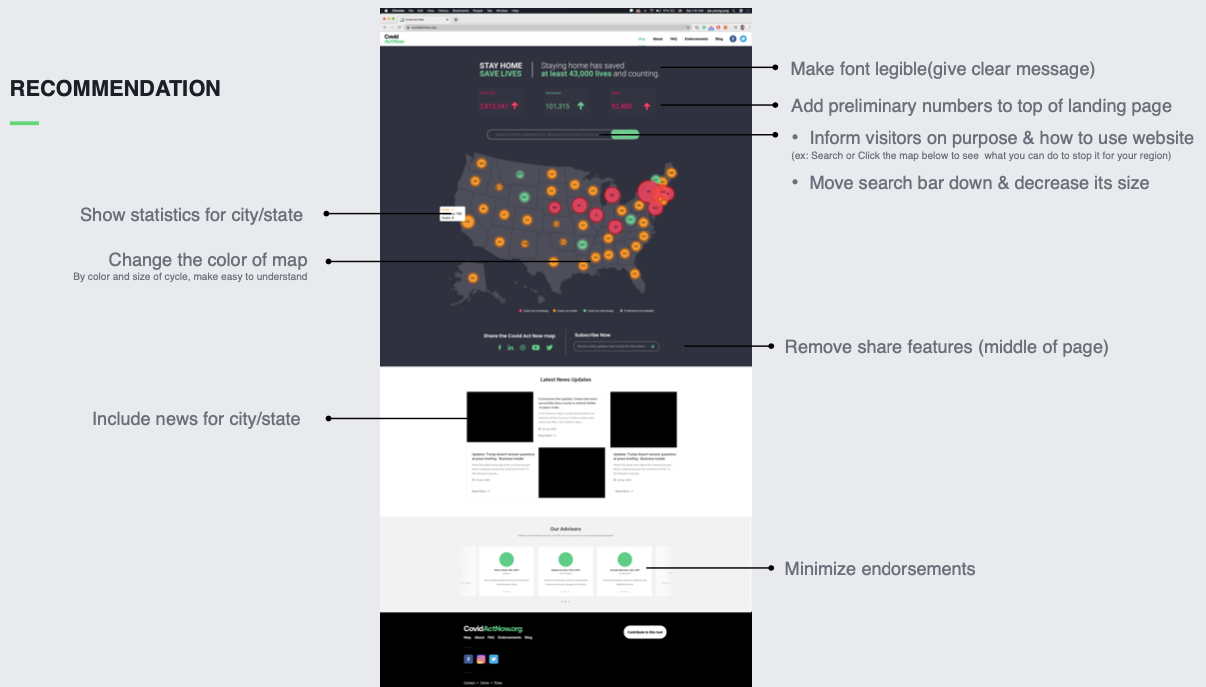
- Remove Share Features
- Use colors that best contrast individual statuses
- Mark states by its interventions
LOW IMPACT, HIGH EFFORT
- Consider presenting data on logical geographic regions
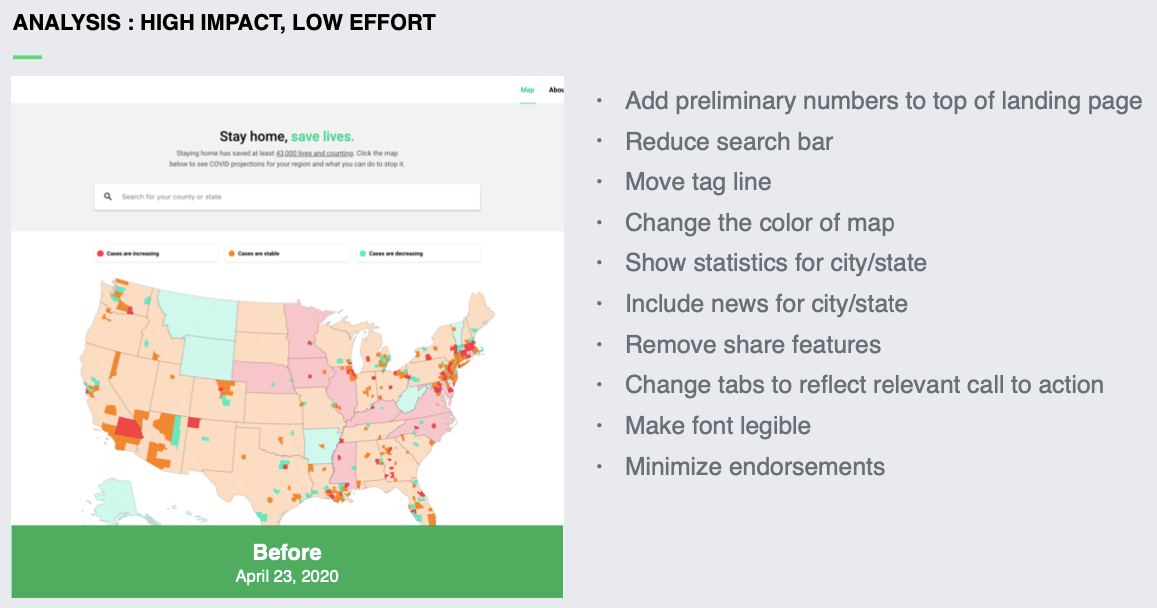
HIGH IMPACT, LOW EFFORT
- Add preliminary numbers to top of landing page Reduce search bar
- Move tag line
- Change the color of map
- Show statistics for city/state
- Include news for city/state
- Remove share features
- Change tabs to reflect relevant call to action Make font legible
- Minimize endorsements
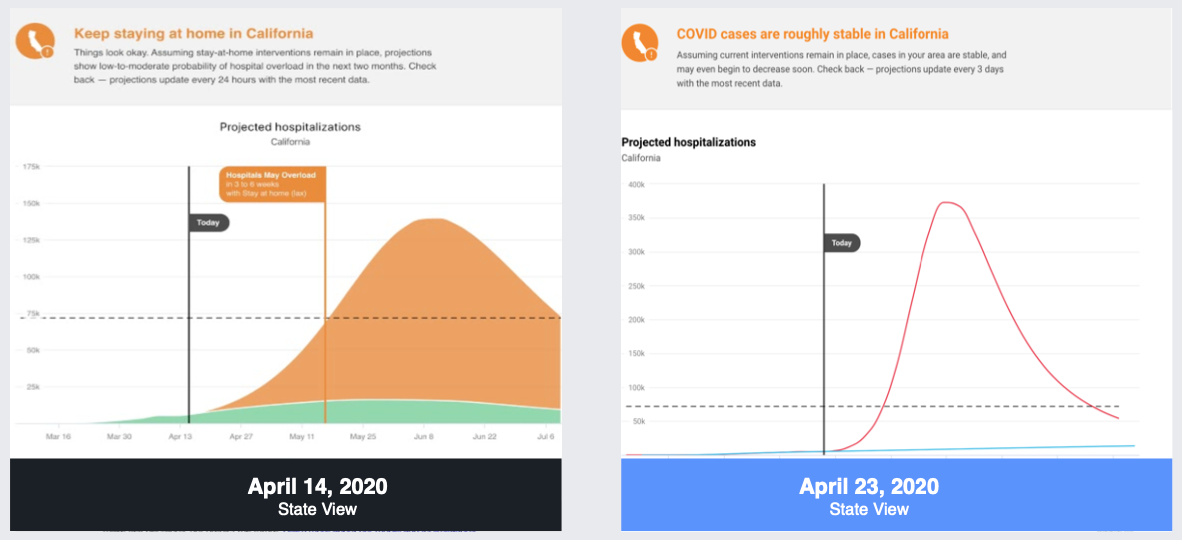
2) Jurisdiction page (state or county data)
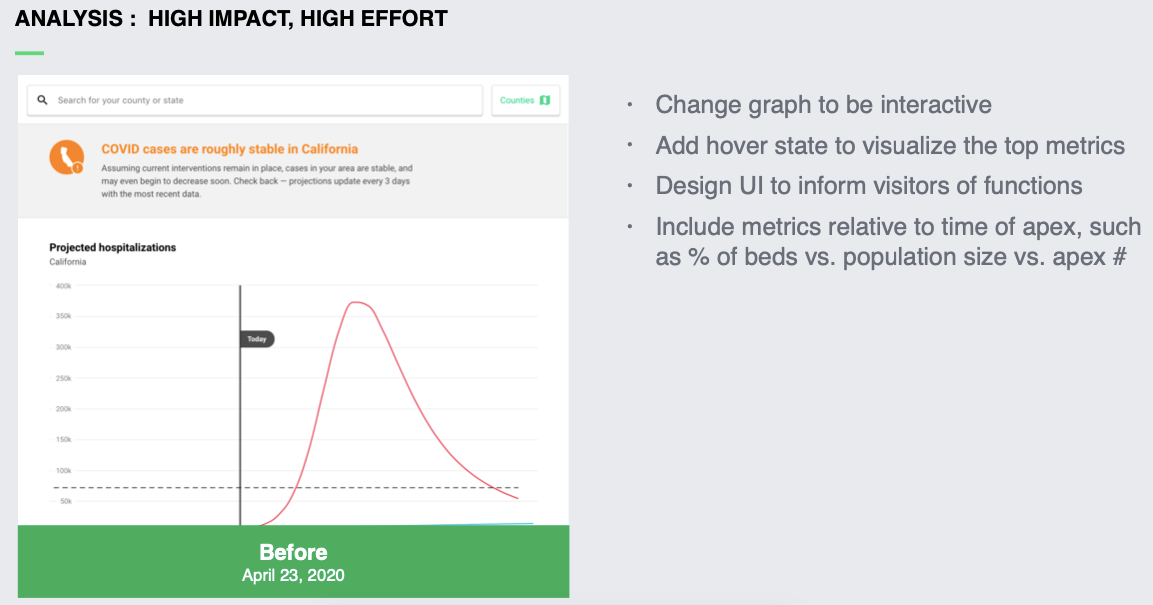
HIGH IMPACT, HIGH EFFORT
- Change graph to be interactive
- Add hover state to visualize the top metrics
- Design UI to inform visitors of functions
- Include metrics relative to time of apex, such as % of beds vs. population size vs. apex #
HIGH IMPACT, LOW EFFORT
- Strong message with visual
- Allow visitors to select data sets to compare
- Always include historical data
- Define the "lax" and "strict" terms for visitors
- Change view to bird's eye and slanted on an angle
- State methodology of including counties with no data
- Increase the font
- Define the sample size collected per state or county
LOW IMPACT, LOW EFFORT
- Add color legend
- Use colors that best contrast changes in hospitalizations over time as per the dates of set interventions
- Add metrics for the date
- Specify the date and time of the numbers on the graph
- Additional Assessment
LOW IMPACT, HIGH EFFORT
- Allow visitors to select comparisons of different counties
- Suggest criterion for comparative data
- Map out the changes of interventions to the dates of hospitalizations
Additional Assessment
As part of our research, we realized that data came from so many sources, that many organizations were using obsolete or inaccurate data; impacting the efficacy of their solution. CovidActNow was unique in that it was aggregating data from multiple sources and cross-referencing them to increase the fidelity of the data. This is how the forecasts are supported and endorsed by a number of experts in epidemiology, public health, and medicine (Validation).
» Their data is publicly available via API